Images, Charts, and Graphs
Most scientific posters have lots of writing and text that provides a thorough overview of the research, but most people who view those posters do not have the time to read the entire thing. Good images and graphics can tell most of the story quicker and easier, and therefore it’s crucial to make sure these elements are clear and concise.
Image Resolution
When getting a poster printed, you want to make sure the resolution of photos and images is as high as possible so they do not print grainy or pixelated. The best way to do this is to zoom in on your file to 100% and see how everything looks. This is very close to how it will look when printed, so if anything seems pixelated or poor quality, do your best to find something better. (If you are going to be ordering a poster that is larger than your file, zoom in farther)
Another option is to use vector graphics, which are images that can scale to any size without losing quality. These are typically .svg, .eps, .wmf, or .emf files and are commonly used for logos and simple illustrations. (If you are creating your poster in PowerPoint, we recommend .emf or .wmf as some versions cannot handle .svg and .eps). If you have the option between a vector file and a normal image like a .jpg or a .png, we recommend using the former. If you have to use a .jpg or .png, try to use the largest size available to make sure it prints well. We also do not recommend using screenshots.

Charts and Tables
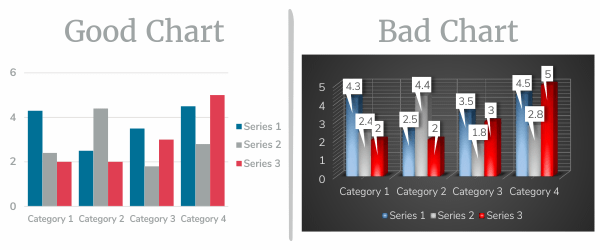
Since there will be a lot of information on your poster, keeping tables and charts simple and easy to understand is much better than an in-depth and complicated graphic. There are a few simple tricks to simplify charts and tables:
- 1 Remove unnecessary borders, lines, and backgrounds
- 2 Remove unnecessary labels and markers
- 3 Use flat styles and solid colors
- 4 Highlight important values


Questions, Comments, or Concerns
If you have any further questions or comments about our tutorials, we would love to help you out.

